
How to Look Up Cook County Jail Population Data
Capacity and classification data live on the Sheriff's divisions of jail page. The Clerk's new public data dashboard, announced in 2025, expands court-side population transparency. The Bureau of Justice Statistics at bjs.ojp.gov publishes the national jail population benchmarks that Cook County figures are usually compared against.
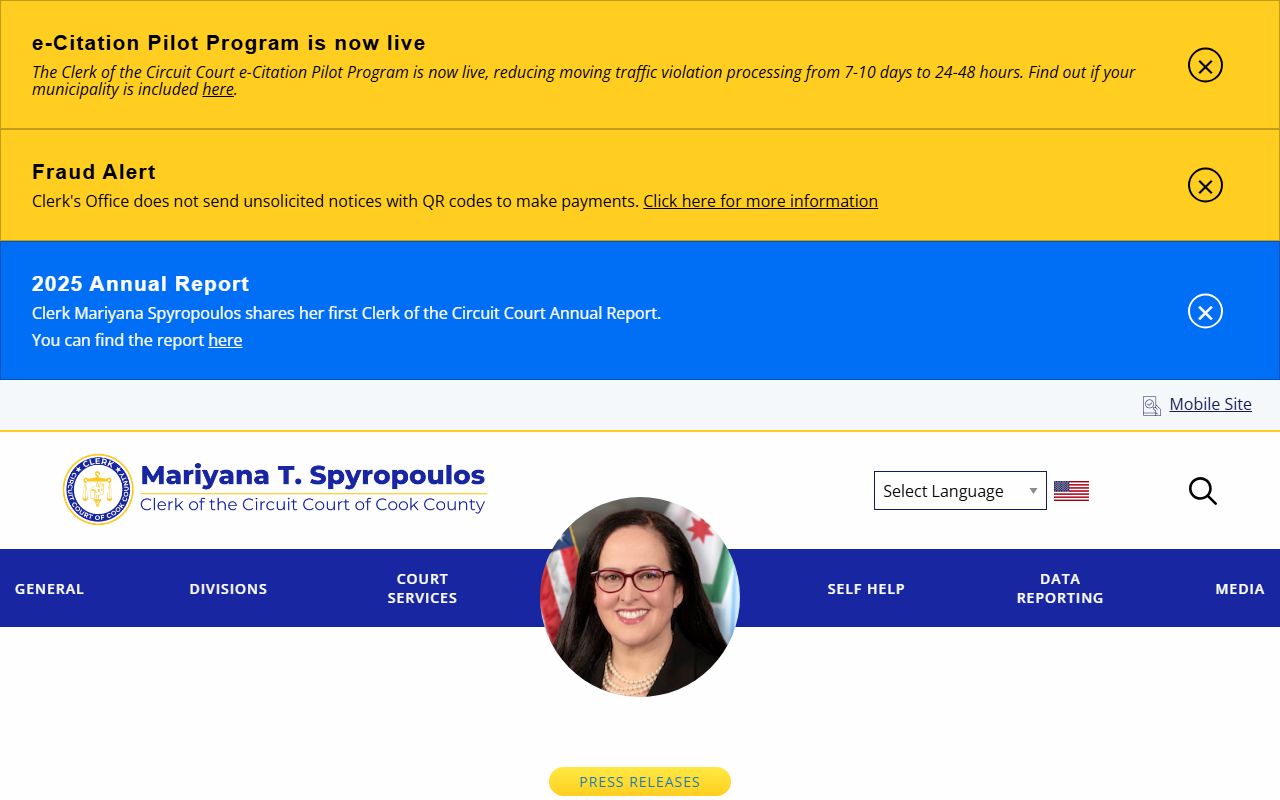
The Clerk's data dashboard press release is below; it describes the dashboard concept and the Clerk's modernization push.
Note: This page focuses on jail population data. To search by an individual name, use Cook County inmate records instead.
Cook County Jail Capacity Overview
Cook County Jail is a campus of separate buildings, each with its own classification and history. The Sheriff publishes housing capabilities and design capacities. The Sheriff's jail-divisions page is shown below.

| Division | Address | Capacity (Design or Active Housing) |
|---|---|---|
| Division II | 2700 S. California Ave. | Active dormitory: 592 + 684 = 1,276; original design 870 |
| Division III Annex | 2700 S. California Ave. complex | 434 |
| Division VI | 2801 S. Sacramento Ave. | 992 |
| Division IX | 2834 W. 31st Street | 1,056 design |
| Division X | 2950 S. California Ave. | 768 design |
| Division XI | 3015 S. California Blvd. | 1,536 |
| Division XVI | Jail complex | 200 |
| Inactive Division I | 2700 S. California Ave. | 1,250 historical maximum; inactive |
| Inactive Division IV | 2717 S. Sacramento Ave. | 704; currently closed |
Adding the listed active and design figures from the Sheriff's page produces an approximate total of 6,262 across the listed active divisions. This figure excludes the closed Division IV and the inactive Divisions I and III. It should not be treated as a current operational capacity unless the Sheriff publishes a consolidated number.
Active vs Inactive Housing
Active divisions house general population men and women at minimum, medium, and maximum security levels. Division III Annex is the women's general population unit; Division XI is the largest medium-security men's facility; Division X has converted from medical or acute psychiatric use to general population male housing.
Inactive Division I, opened in 1929, is the oldest building on the campus. Inactive Division III is an overflow building used during population spikes. Division IV is closed. These spaces matter for population planning because they can be reopened, but they do not count toward the day-to-day operational capacity.
Mental Health and Medical Population
Division XVI began as the Vocational Rehabilitation Impact Center and Boot Camp in 1997. It is now used for the Mental Health Transition Center and programming participants, and was used as a COVID isolation space at one point. The Sheriff's programs and services page covers educational, vocational, religious, substance-abuse, veterans, and community-support tracks. The screenshot of that page is below.

Average Daily Population
Average daily population is the measure most often quoted for a jail. It counts how many people are held on a typical day across all active divisions. Cook County publishes this figure through the Sheriff's office and the Office of the Chief Judge rather than on the static jail-divisions page. The number moves with arrests, charging decisions, court processing time, and electronic monitoring placements.
Because the figure changes daily, treat any single number as a snapshot. The Sheriff's daily count and the Chief Judge's pretrial-services reports are the authoritative local sources. Aggregators that publish a fixed population number are usually quoting an old snapshot.
Note: Cook County moved a large share of its pretrial population to electronic monitoring over the past decade, so the in-building count is lower than the total number of people under Sheriff supervision.
Pretrial vs Sentenced Population
Most people in Cook County Jail are pretrial detainees, not sentenced prisoners. A pretrial detainee is held while the case is pending and has not been convicted. A sentenced person serving time is usually transferred to the Illinois Department of Corrections rather than kept in the county jail. That split is why the jail population tracks court processing speed so closely.
| Status | Where Held | What It Means |
|---|---|---|
| Pretrial detained | Cook County Jail | Case pending; ordered detained under post-2023 pretrial rules |
| Pretrial released | Community or electronic monitoring | Released with conditions while the case proceeds |
| Sentenced to county time | Cook County Jail (short terms) | Short misdemeanor or county sentences |
| Sentenced to prison | Illinois Department of Corrections | Felony prison terms; transferred out of the county jail |
Demographic Breakdown and Charge Mix
The Bureau of Justice Statistics tracks jail population by race, sex, and age across the country. Cook County's own demographic detail comes from Sheriff data and the Chief Judge's pretrial reports. Charge mix matters too. A jail dominated by felony pretrial detainees behaves differently from one holding mostly short misdemeanor sentences.
The Sheriff publishes classification levels by division, which is a rough proxy for charge severity. Division XI and Division IX hold medium and maximum classifications. Division II and Division III Annex hold minimum and medium populations. The women's general population is housed in Division III Annex.
Cost and Staffing
Cook County jail cost data lives in the annual county budget volumes and the Sheriff's budget submission rather than on the public jail-divisions page. Cost per detainee per day, the annual corrections budget, and staffing ratios are published there each fiscal year. For current cost figures, the county budget office and the Sheriff's annual report are the right sources.
Note: Jail cost per detainee is high relative to community supervision, which is one reason Cook County expanded electronic monitoring and pretrial release.
Pretrial Reform and Population Drivers
After September 18, 2023, Illinois eliminated cash bond for new criminal cases. The change has shifted the pretrial-detention mix because the jail population is no longer driven by inability to pay money bond. Courts decide release or detention based on charge, history, and pretrial-services input.
Jail population also depends on felony charging volume, court processing time, sentencing transfers to the Illinois Department of Corrections, electronic monitoring use, and mental-health treatment capacity. The Public Defender's office at cookcountypublicdefender.org serves the indigent defense population that drives a large share of pretrial detention; the Public Defender bio page is below.

Where Cook County Jail Data Comes From
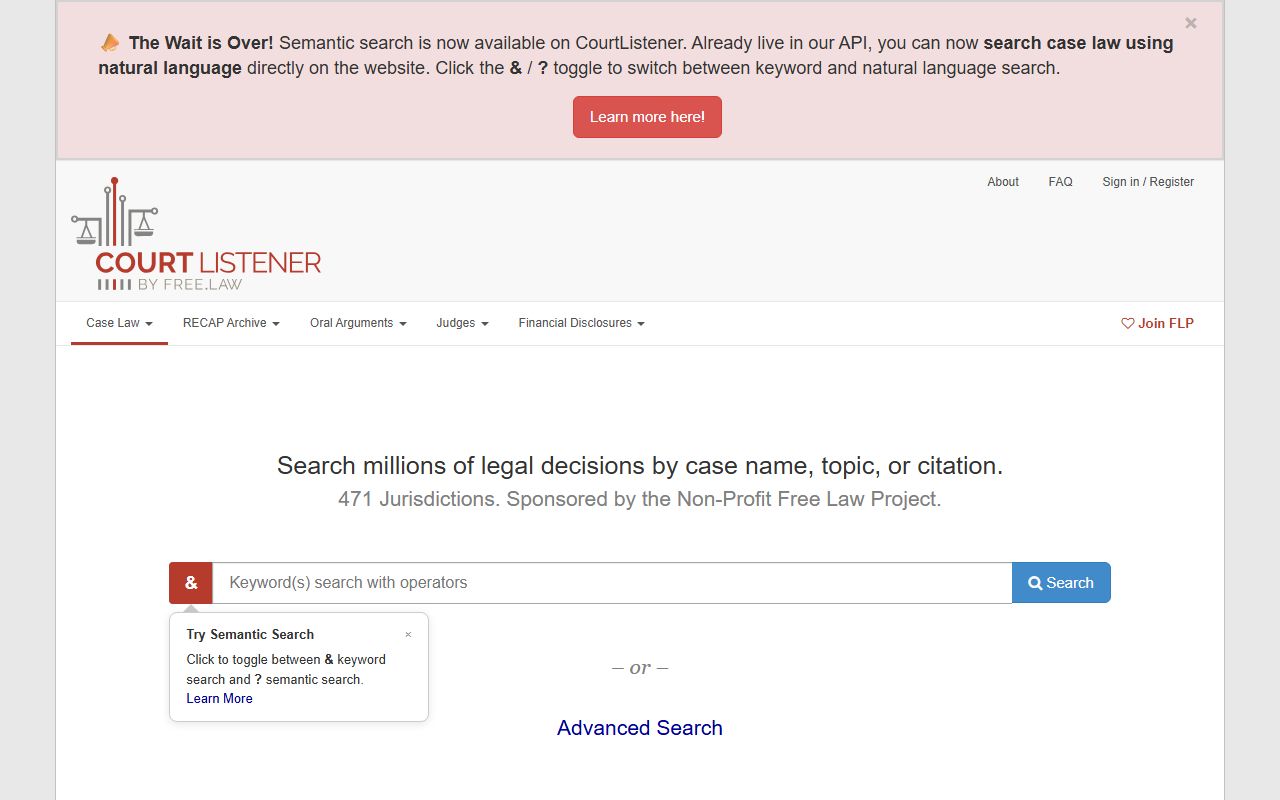
The Sheriff's jail divisions page identifies housing, classifications, and historic capacities. The Clerk's 2025 data dashboard publishes court-side metrics. Cook County's budget volumes carry annual jail and corrections cost data. The Office of the Chief Judge tracks pretrial-services statistics. CourtListener at courtlistener.com is a free non-government source for federal court opinions and dockets that can help fill out context for federal cases. The CourtListener home page is below.
National Context From BJS
The Bureau of Justice Statistics at bjs.ojp.gov publishes the standard national jail population datasets. BJS reports per-100,000 jail rates by state and by major metro, average daily population trends, pretrial-vs-sentenced splits, and demographic detail. Cook County's adult jail complex has historically been one of the largest local jail systems in the country.
| Comparison | What BJS Publishes |
|---|---|
| County rate | Per-100,000 jail incarceration rate for Cook County over time |
| State rate | Illinois jail incarceration rate compared with neighboring states |
| National rate | U.S. local jail incarceration benchmark per 100,000 |
| Pretrial / sentenced split | Share of jail population awaiting trial vs serving a sentence |
| Demographic detail | Race, sex, and age categories |
For Cook County specifically, the Sheriff and the Office of the Chief Judge are better sources for local-only data because BJS aggregates by jurisdiction.
Cook County Jail Population Trends
Jail population in Cook County has dropped sharply over the past decade, driven by the Cook County State's Attorney's bond reform, the Sheriff's electronic monitoring program, the Public Defender's pretrial litigation, and the September 2023 statewide cash-bond elimination. Specific current numbers should be confirmed against the most recent Sheriff or Office of the Chief Judge publications.
Note: Local jail population numbers move month to month. Use the Sheriff and Office of the Chief Judge publications as the primary source rather than secondhand reporting.
Searching for Cook County Inmate Records by Name
Looking for a single person rather than population data? Use Cook County inmate records for the Sheriff's Individual in Custody Locator, plus the Illinois Department of Corrections and BOP federal searches for transferred individuals.